The “Plan vs Actual” report is a report that allows you to compare planned and actual financial results by categories or projects.
This report helps users effectively plan budgets, track goal attainment, and control variances in income and expenses.
📍 Where is the report located?
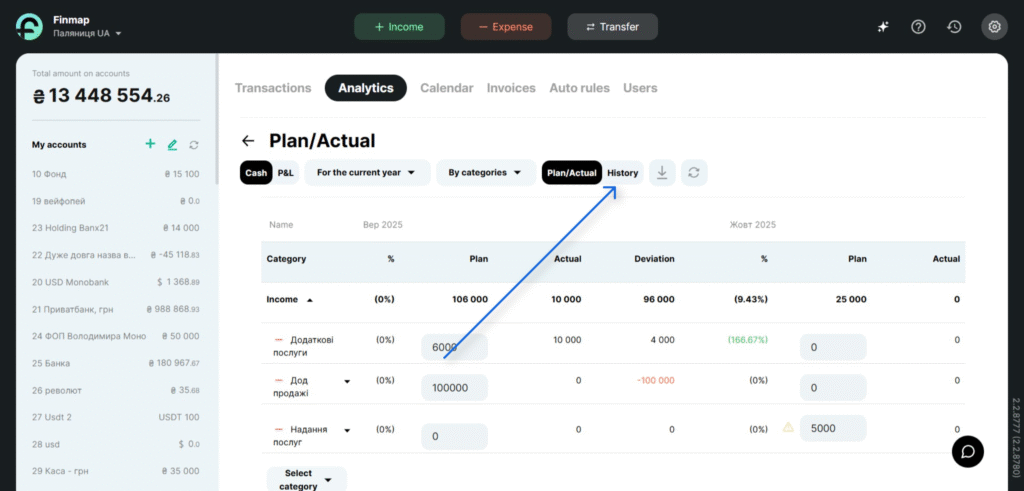
The “Plan vs Actual” report is located in the “Analytics” section.
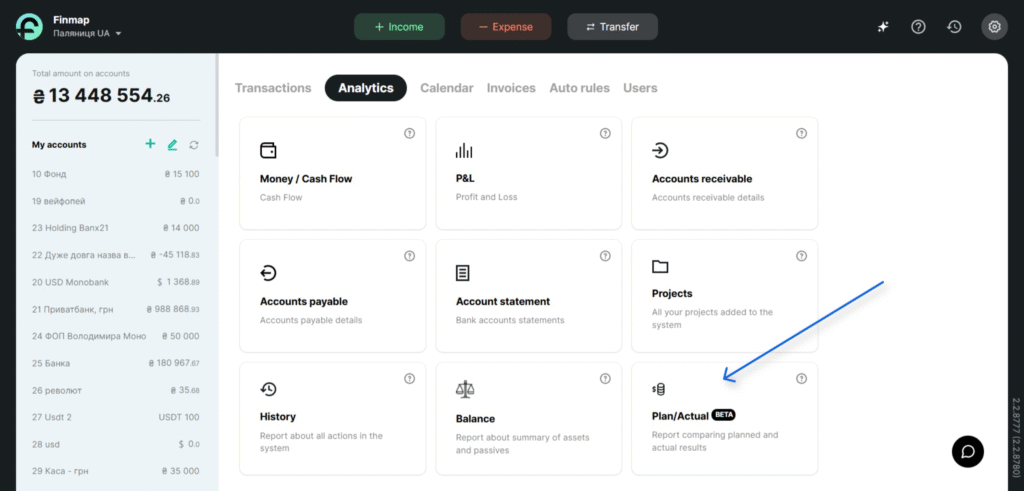
It is available to company owners and to users with the system role “Full Access.”
⚙️ How is the report generated?
By default, the report is generated with the following filters:
- For the Cash Flow report.
- For the current month;
- By categories.

If needed, you can change the report type:
- Cash Flow — data is based on the receipt/withdrawal dates of your payments (only actual payments are included);
- P&L — data is based on the deal dates/periods of your payments (only actual payments are included).
You can also apply a filter by entity type:
- By categories;
- By projects.
📊 How the report works
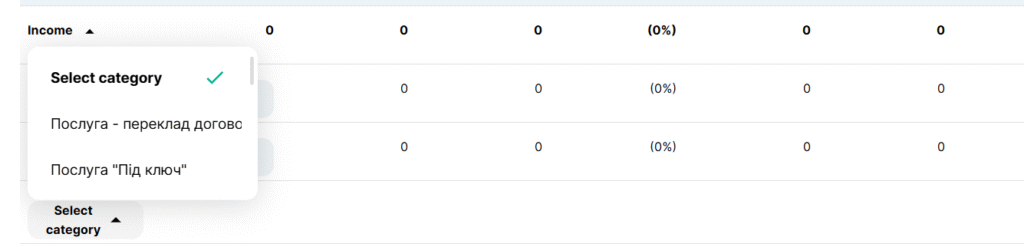
- You need to select a category and enter the planned income/expense amount in the corresponding field, which automatically saves the value you enter.

❕ If you add a category but do not enter a value, the category addition will not be saved after the page is reloaded, because it is saved only after an amount is entered.
- The planned amount can be changed at any time.
- Actual data are automatically populated from the Cash Flow or P&L reports, depending on the selected filter.
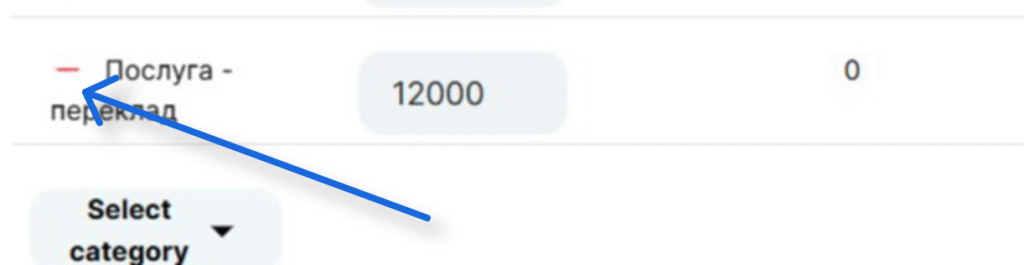
- Clicking the “−” button removes the category from the report.
❕If you delete a category that contains subcategories, all values for that category and its subcategories are removed.
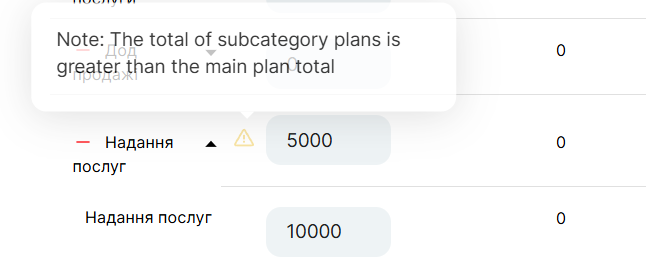
- If the amount in the main (parent) category is 5,000 but the total across its subcategories is 7,000, the system will display an exclamation-mark icon indicating an error.
- By clicking the actual income/expense amount, you can open the payments associated with the corresponding category for the selected time period.
- If the planned income/expense total exceeds the actual total, the ratio of actual to planned will be below 100%; if the actual income/expense total exceeds the planned total, the ratio will be above 100%.
When actual income is higher, the actual-to-planned income ratio is shown in green, highlighting a positive financial result. When actual expenses are higher, the actual-to-planned expense ratio is shown in red, indicating that the financial plan was not met.


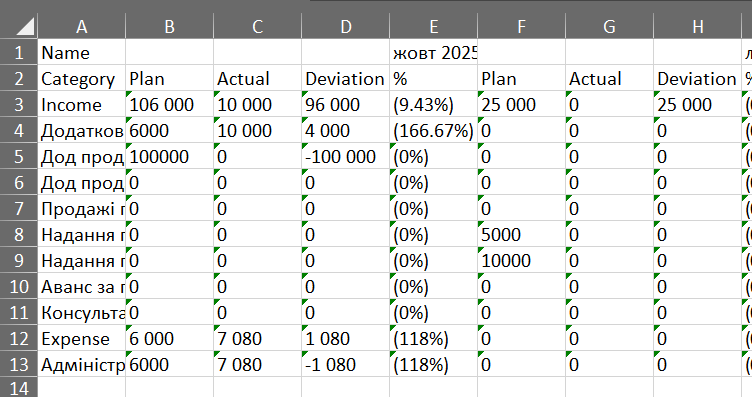
📃 Export
When you export data from the “Plan vs Actual” report, the system generates an XLSX file with the same tables as in the in-service report, according to the filters applied in the report at the time of export.

📑 Activity history in the “Plan vs Actual” report
The report includes a separate “Activity History” tab that shows which entities—with which income/expense amounts—were added as planned, which planned income/expense amounts were edited, and which entities were removed from the report.
The Activity History displays the following data:
- Creation — when the planned amount was entered.
- Editing — when and to which exact amount the planned value was changed.
- Deletion — when the entity was removed from the report;
- User — the person who performed the action.
- Time — the exact date and time when the action was performed.
- Period — the specific month for which the amount was edited.
Filtering options in the “Activity History”:
- The Activity History is generated separately for each report type: Cash Flow and P&L.
- The history can be viewed by entity type: By categories and By projects.
- You can also select a time filter (this filter takes into account the exact time the action was performed: creation, editing, or deletion).
If an entity (e.g., a category or a project) was deleted in Settings, it will also appear in the Plan vs Actual report’s Activity History as deleted and will be automatically removed from the report.