ㅤㅤReport Money (Cash Flow) – cash flow statement. The report shows how much money has physically come to your accounts and how much has gone out. CashFlow does not show profits, but only the physical turnover of funds.
ㅤㅤ
ㅤIn Finmap, it is generated relative to the date of receipt or write-off specified in the payment

ㅤㅤ
ㅤㅤ
ㅤㅤ
ㅤㅤView the Cash Flow report
ㅤ
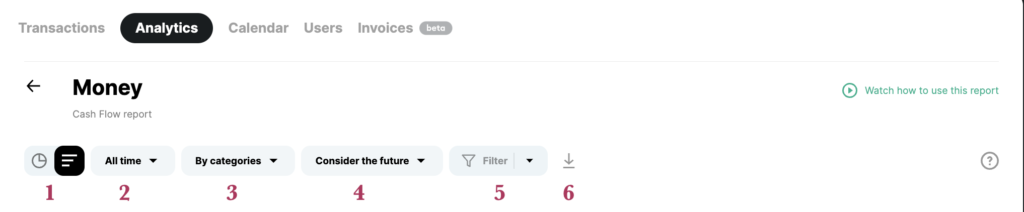
We can view the report in both graphical and tabular formats (1). In both data display formats, we have filters:
ㅤㅤㅤ
ㅤ
- Filter by date (2)
- Filter by category, project, counterparty (3)
- Switching data with and without regard to future transactions (4)
- Advanced filter by entities in the service and saved filters (5)
- Download the report data to our device (6)
ㅤㅤ
ㅤㅤ
ㅤㅤㅤㅤ
ㅤㅤ
ㅤㅤTable view of the report
ㅤㅤ
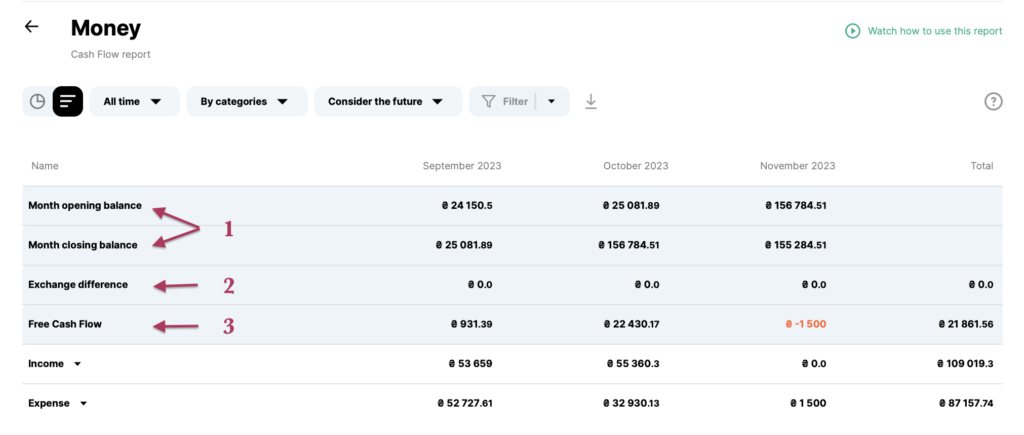
In a tabular format, the data is presented that is generated exclusively in the Money report, namely:
1️⃣ Opening and closing balance of the month
ㅤ📌 The balance at the end of the month is calculated using the formula:
beginning of the month balance + net cash flow + opening account balances + translation of balances at the rate of the National Bank. Bank = balance at the end of the month
ㅤYou can now filter and view information on the beginning and end balances of a period for individual accounts by applying the corresponding account filter.
2️⃣ Currency fluctuations and transfers
ㅤExchange rate differences are the revaluation of cash. When the currency of some accounts is different from the company’s main currency, exchange rate fluctuations result in exchange rate differences. That is, the same amount in the account balance at the beginning of the month gives us one amount in the main currency and the same account balance, but at the end of the month it may give us a different amount in the main currency of the company due to a jump in the exchange rate.
ㅤ
3️⃣ Free Cash Flow
ㅤThis is the difference between income and expenses (cash balance). It shows how much more or less money your company — or a specific account — has at the end of the period.
ㅤ
ㅤIf custom exchange rates were set for income or expense transactions, they will be taken into account specifically in the net cash flow. The recalculation based on the National Bank’s rate will be reflected in the “Month opening/closing balance” indicators.
ㅤ
ㅤㅤ
ㅤㅤGraphical view of the report
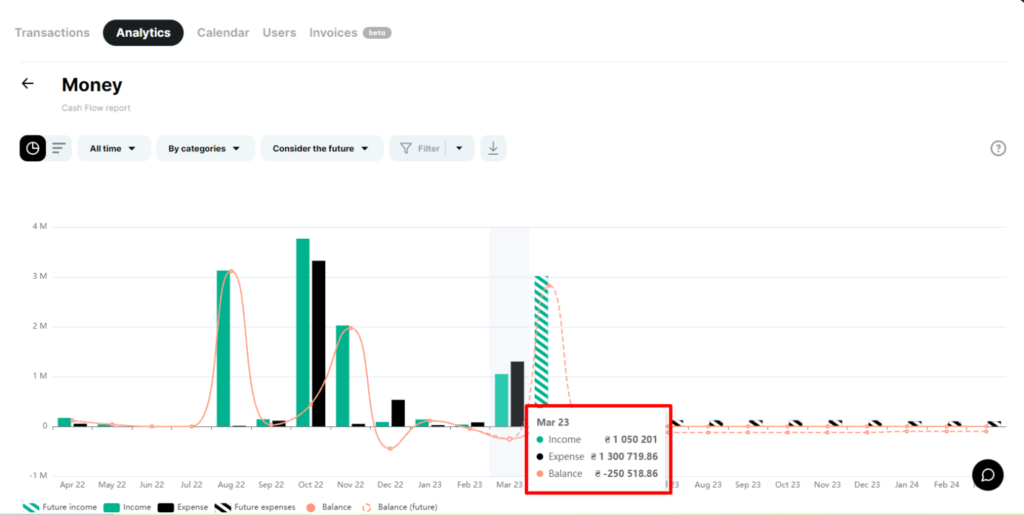
The graphs show aggregate information about receipts, write-offs, and balances. The buttons below the graph are clickable and you can select the desired information to display
….
ㅤㅤPie charts
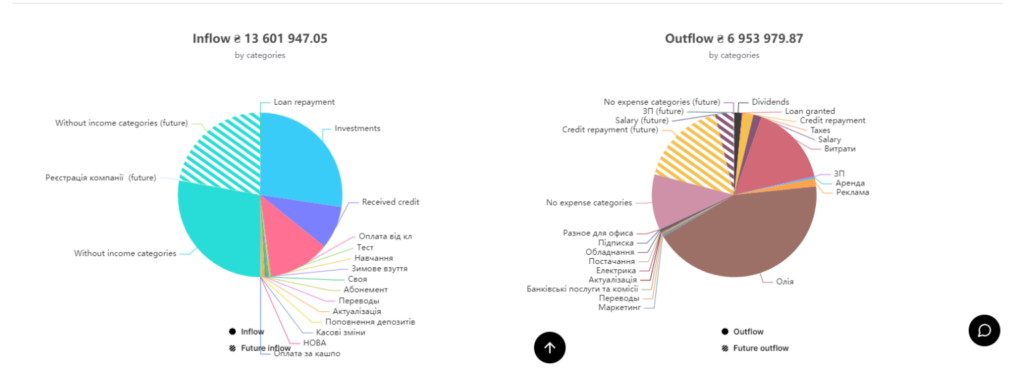
Pie charts display analytics by Category, Project, or Counterparty
When you click on the block with the desired category, the service will show what subcategories it consists of
By clicking on a separate sector, you can view information on a specific entity and then go back
ㅤㅤSchedules of receipts and payments by category
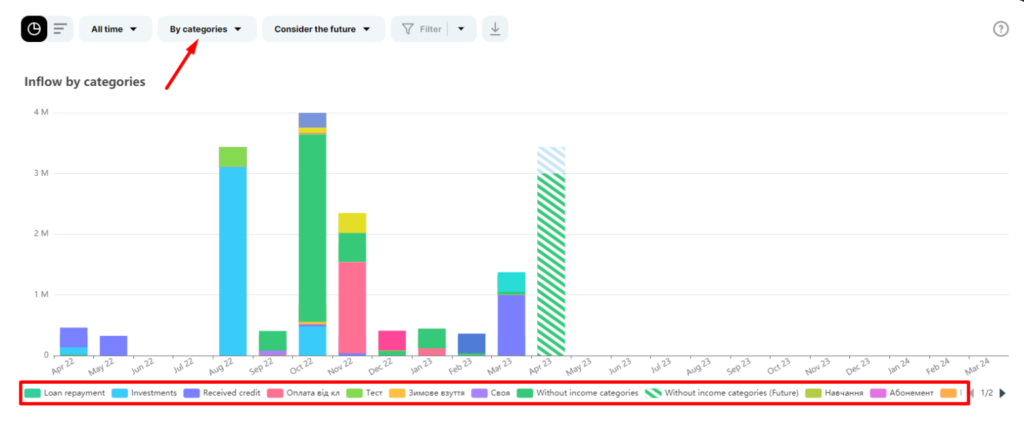
In this graph, you can click on the columns for a more detailed display of the transactions that make up the total amount
And also, include or exclude the necessary information thanks to the clickable buttons below the graph
ㅤㅤ
ㅤ
ㅤRead more about generating a report
ㅤ
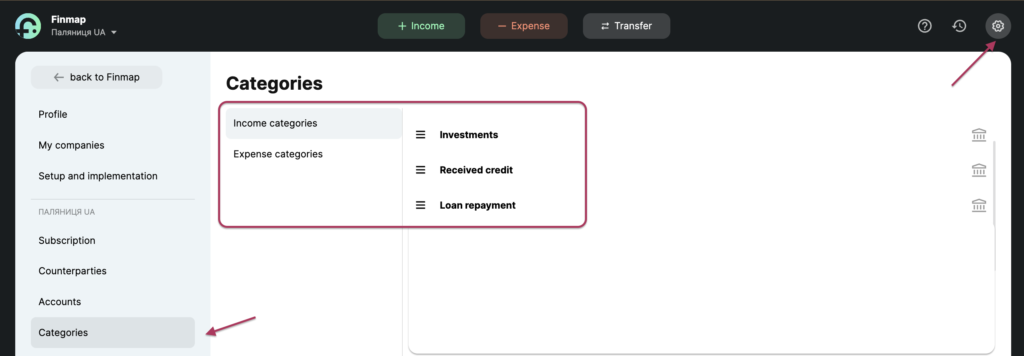
ㅤIt is worth noting that the Money report includes some system categories that are not included in the Profit report.
These are income categories such as: Investments, Loan repayment, and Loan receipt.
And categories of expenses: Dividends, Loan issuance, Loan repayment
ㅤ
ㅤ
ㅤThe above categories are, in fact, only cash flows that do not affect your company’s profit. After all, investments must be returned in the form of dividends, the loan received must be repaid, and the loan issued must be returned to you.