ㅤIf you have several business lines, you can display them in Finmap as projects
This way you can view reports both for the company as a whole and for individual business lines
ㅤ
ㅤㅤLet’s take an example:
ㅤThe company has 2 areas of activity: a natural cosmetics boutique Lavender Boutique and a textile store – Lux Textile
Accordingly, we create 2 accounts and 2 projects in the company with the appropriate names
ㅤ
ㅤWhat we get as a result:
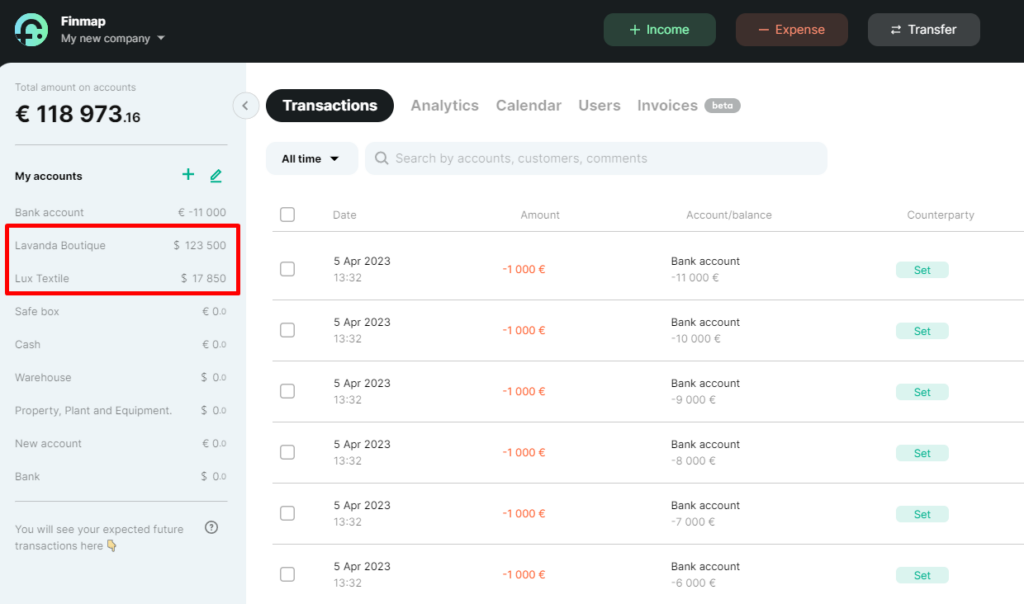
ㅤ📌 In the accounts sidebar, we can see the current account balances for the relevant business lines
ㅤ
ㅤ
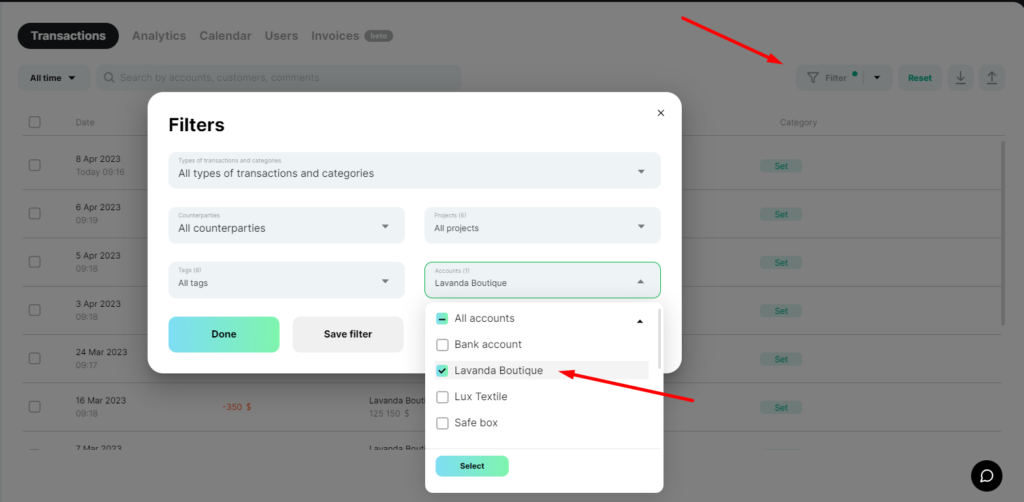
ㅤ📌 In Payments, we can filter receipts and write-offs from any of the projects (or business lines) at any time, if necessary
ㅤ
ㅤTo do this, in the advanced filters, select the desired project, for example, Lavender Boutique. And view the information we need
ㅤ
ㅤ
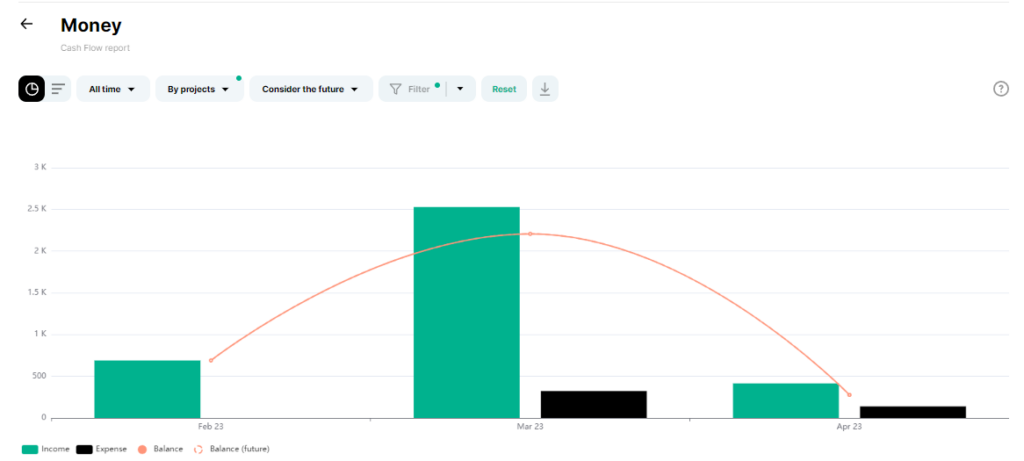
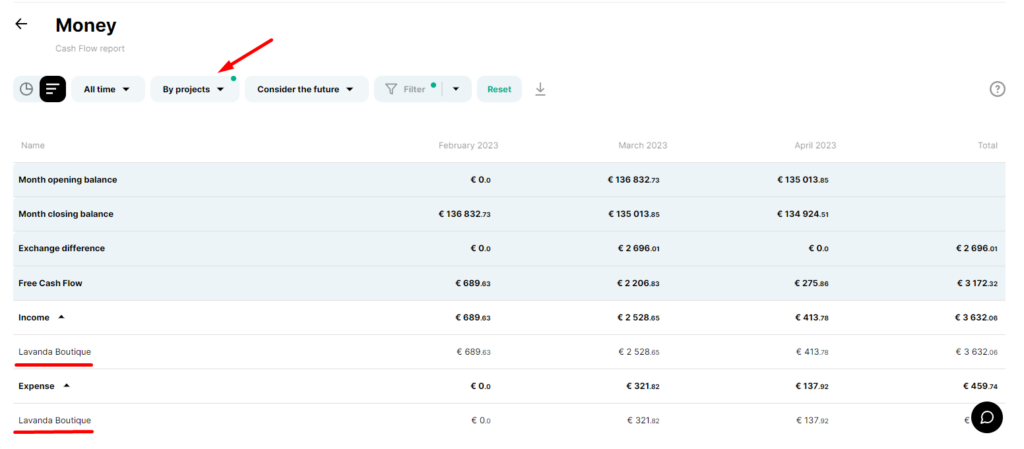
ㅤ📌 You can check the reports for both business lines as an entire report and each project separately. So, for example, go to Analytics, the Money report – and set the filter “By project”
ㅤ
ㅤ
ㅤYou can see all the information in colourful graphs and tabular form. In this report, we can see information about incomes and expenses for a particular project
ㅤ
ㅤ
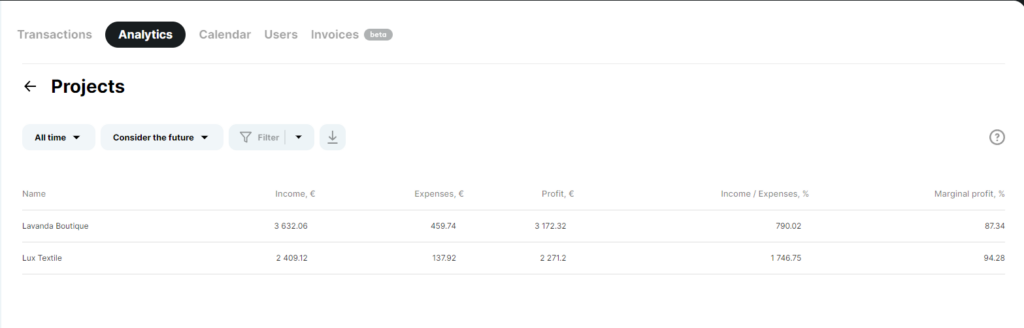
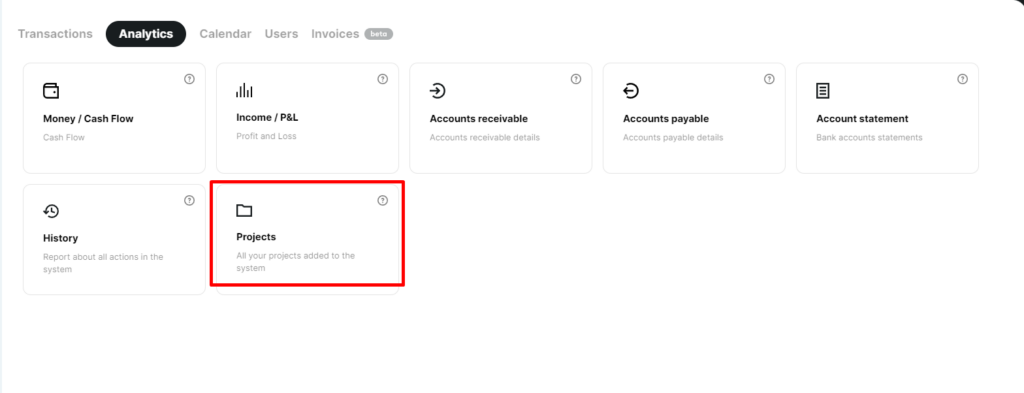
ㅤ📌 There is a separate report for projects in Analytics
ㅤ
ㅤ
ㅤHere you can view all incomes, expenses, profit and profitability of your projects and business areas
ㅤ