ㅤ
What is it and why?
Every business has its own figures that previously had to be calculated in Excel: how much percent of revenue is eaten up by advertising, what is the share of individual entrepreneurs’ taxes, what is the ROI in the direction.
Now such an indicator can be set up once – and Finmap will calculate it automatically every month.
ㅤ
Where to find
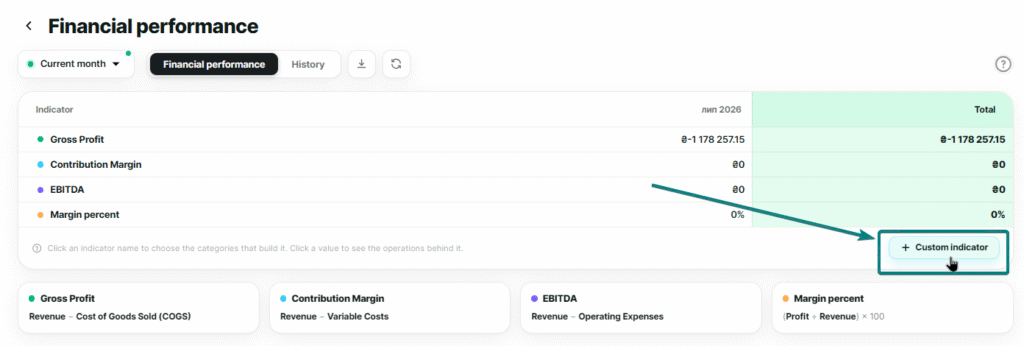
Analytics → Financial indicators. The section is available to company owners and users with full access.
ㅤ
How to create a metric
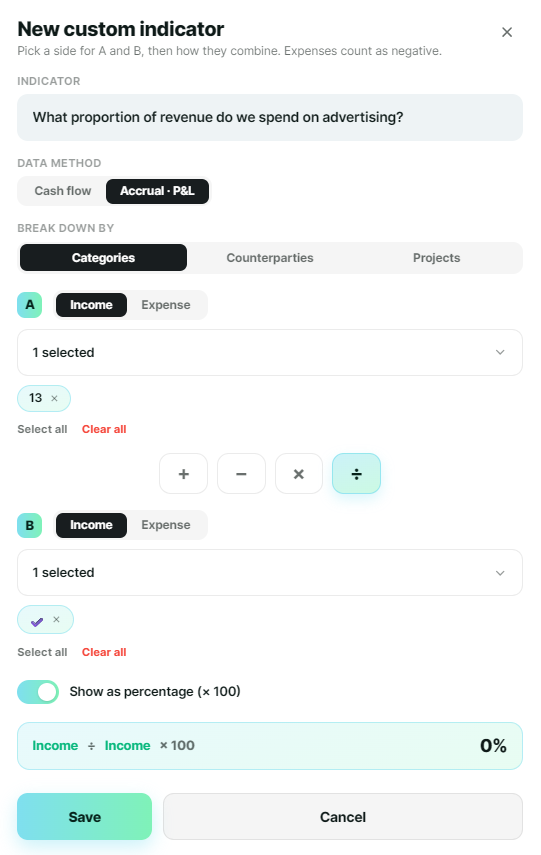
Let’s take an example: “What proportion of revenue do we spend on advertising?”
Formula: advertising costs ÷ revenue × 100%.
- Click “+ Custom metric” and name it — for example, “Advertising share of revenue.”
- Fill in the top part of the formula (this is what we’re dividing by): select Expenses → Categories breakdown → category “Advertising.”
- Fill in the bottom part (this is what we’re dividing by): select Revenue.
- Choose an action between them — in our case, ÷.
- Turn on “Show as percentage (× 100).”
- Look at the preview — Finmap will immediately show the result for the current month. If the number looks correct, click “Save.”
Done. The indicator will appear in the report table and will be calculated automatically every month.
Any other indicator is collected using the same logic – just substitute your categories, counterparties or projects and the desired action (+, −, × or ÷).
ㅤ
ㅤ
Saved filter sets
Categories, contractors, or projects are saved with the indicator – you don’t need to select them again every month.
To change something:
- click on the name of the indicator – the editing window will open;
- click on the amount – the list of operations that made up the result will open.
ㅤ
Frequently asked questions
Why is the “+” button inactive?
You selected Income and Expenses at the same time — they cannot be added. Use −, ×, or ÷.
What to choose — Cash flow or Accruals · P&L?
Cash flow — calculates based on the actual movement of money. Accrual · P&L — based on the accrual date. Choose the method in which you usually view reports.
How many metrics can be created?
As many as you want, there are no limits.
Is it possible to break down the indicator by categories and by projects?
No, there is only one type of breakdown per indicator.
Can I export the report?
Yes, the “Export XLS” button is above the table. And who changed the indicators and when is visible on the “History” tab.
ㅤ