


Contents
Financial performance in Finmap
Financial Indicators is a report in Analytics that helps businesses assess profitability based on actual revenues and expenses in Finmap. The report shows how key indicators are formed, which areas…
The report is based on data from the Income Statement (P&L). The indicators are not calculated automatically - first you need to select which categories of income and expenses should be included in the calculation of each of them. After saving the selection, the system calculates the values by month and displays them in the table.
Where to find the report
The section is available via the path: Analytics → Financial indicators. The report is available to company owners and users with full access to Finmap.
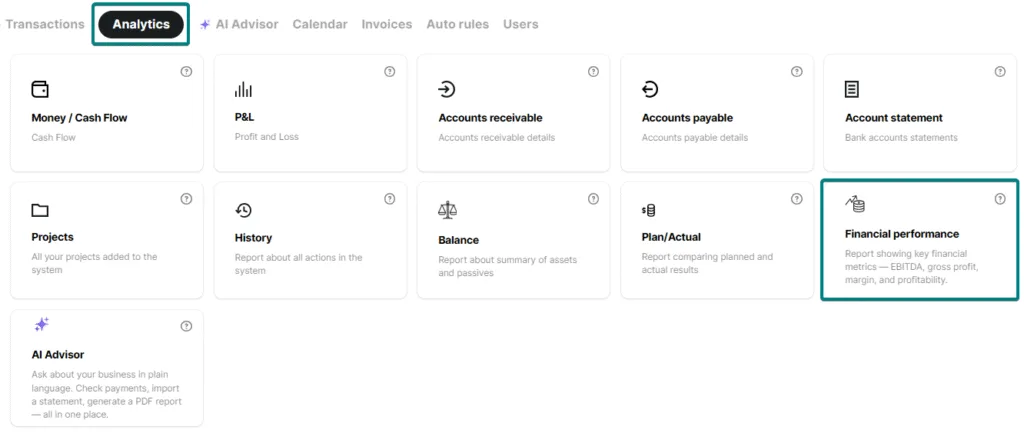
What metrics are available?
The report presents four key indicators:
- Gross profit
- Contribution Margin
- Margin percent
- EBITDA
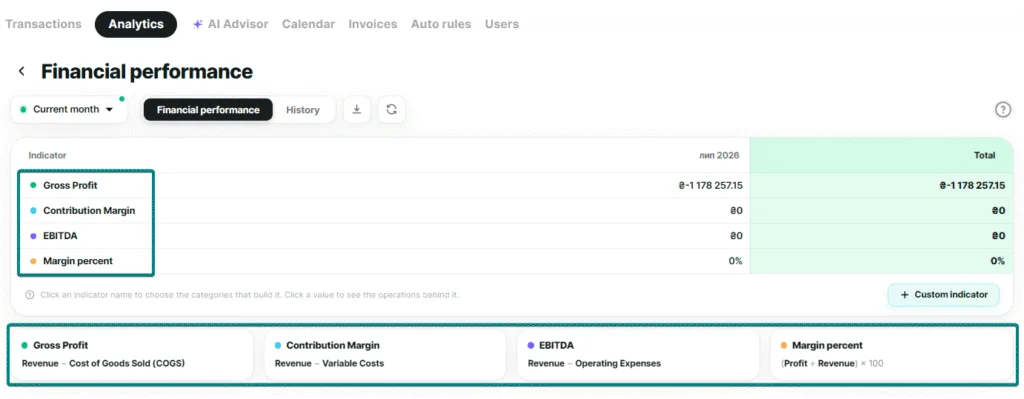
Formulas for calculating indicators
For transparency, the system uses standard financial formulas:
- Gross profit — Revenue – COGS (cost of goods sold)
- Marginal Revenue — Revenue – Variable Costs
- Margin percentage — (Profit ÷ Revenue) × 100%. This is the only metric that is expressed as a percentage.
- EBITDA — Revenue – Operating Expenses
Formulas are shown as separate cards below the report table — so you can immediately see what each number is made up of.
How to choose categories for an indicator
For the indicator to be calculated correctly, you need to indicate which categories of income and expenses it includes:
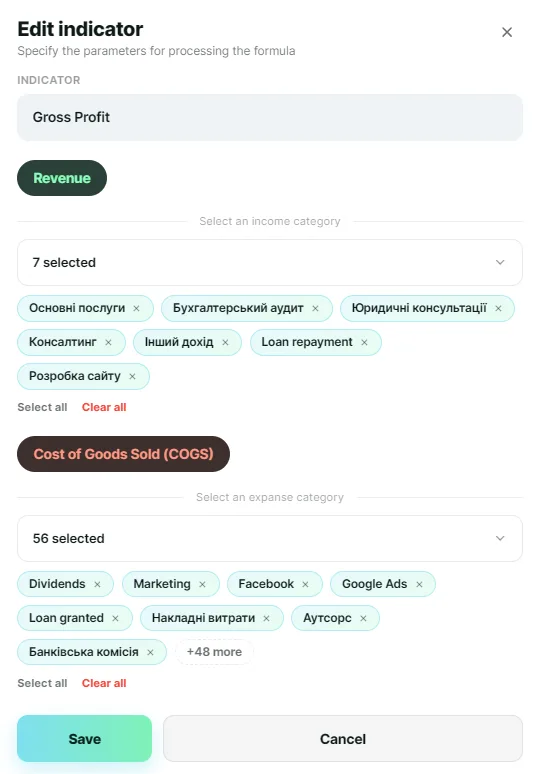
- Click on the indicator name in the table — the “Edit indicator” window will open.
- In the income block, select categories from the list — multiselect works the same as in the report filters.
- In the expense block, select the appropriate categories.
- The selected categories are displayed as separate blocks, each can be removed by clicking ×.
- The “Clear all” button resets the selection in the corresponding block, and the “Select all” / “Reset all” buttons allow you to quickly check or uncheck all categories at once.
- Click “Save” to apply the changes, or “Cancel” to close the window without saving.
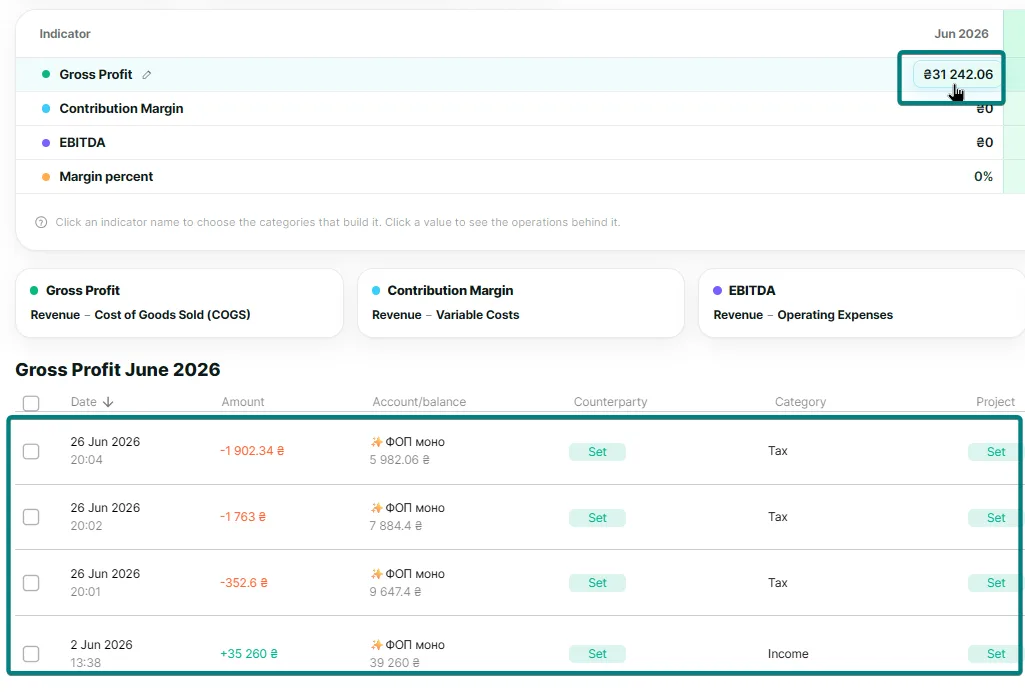
View transactions by indicator
To see which transactions make up the monthly indicator amount, click on the value in the table. A list of transactions with P&L that were included in the calculation according to the selected categories will open.
Why is 0 displayed in the calculation
Financial performance metrics are calculated from the operations for the selected period. If you see 0 in the table, it most often means there are no operations in the relevant categories for that period.
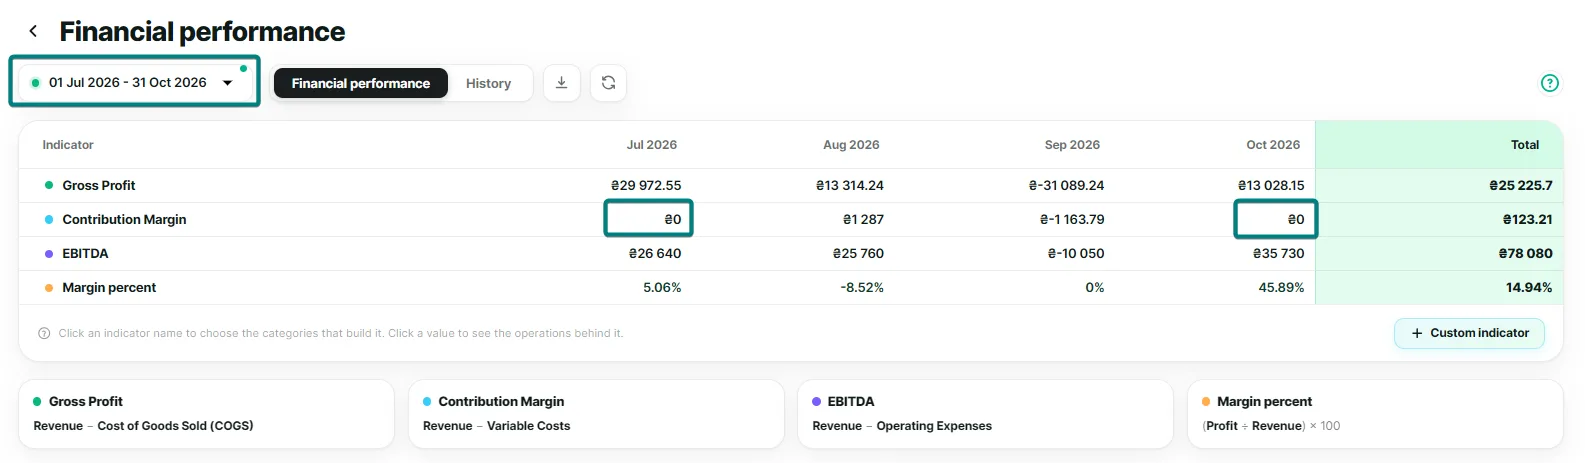
What to check:
Period. Check the period in the filter above the table and make sure the company has operations for that time.
Operations. Open the Transactions section and see whether there are operations for this period. The metrics are built from the Profit report data, so without operations the values will be zero.
Metric categories. Click the metric name and check which income and expense categories are selected for its calculation. If there are no transactions in these categories for the selected period, the table will show 0.
As soon as operations appear in the selected categories for the needed period, the metrics will be calculated automatically.
How to grant employees access to a report
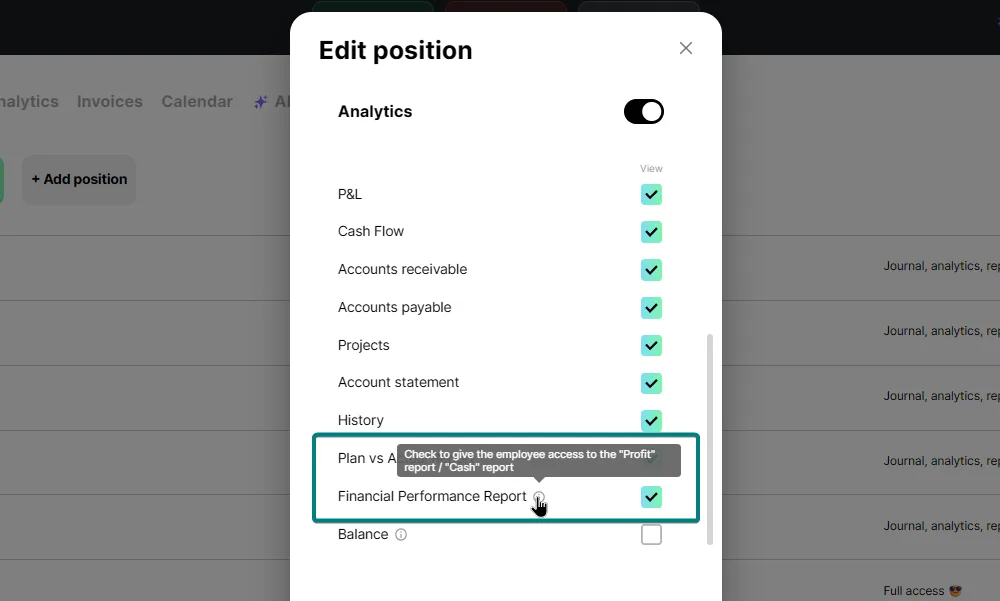
Access to the "Financial performance" report depends on the employee's role within the company:
- Company owners and roles with "Full access" or "View, edit, and delete all" permissions can view the report, add and modify metrics, and delete them as needed.
- Roles with "View and edit all" permissions can view the report and add or modify metrics but cannot delete them.
- Roles with "View all" permissions have view-only access.
- Сustom roles with access enabled for this report have view-only access.
You can configure access for a custom role in the "Users" section: select the relevant role and grant access to the "Financial performance" report, as well as the "Cash Flow" and "P&L" reports.
History of changes
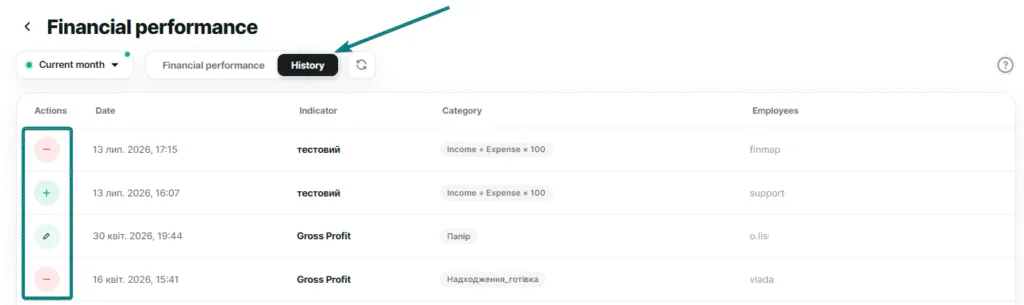
The History tab shows who made changes to your metric settings and when. The table contains five columns:
- Action — add a category (green "+") or remove a category (red "−")
- Date — date and time of change
- Indicator — to which financial indicator does the change belong?
- Category — which category was added or removed
- User — email of the user who made the change
The selected period (for example, "Last 6 months") applies not only to the main report, but also to the history.
Period, export and update data
Above the table are the period switch (for example, "Current month" or "Last 6 months"), the "Financial indicators" / "History" tab switch, as well as the following buttons:
- Export XLS — exports the report in XLS format if you need to transfer it to an accountant, analyst, or add it to internal reporting
- Refresh — lists the report data
Own indicators
In addition to the four standard indicators, you can create your own — using your own formula. To do this, click "+ Custom indicator" and select the data (income or expenses, by category, counterparty or project) and the mathematical operation (+, –, ×, ÷) it will be calculated from, and also give it a name. The indicator can be displayed as an amount or as a percentage.
A detailed step-by-step analysis of this function is in a separate instruction.
📌 Importantly
- The report is available to company owners and users with full access to Finmap.
- The report can be downloaded in XLS format if you need to share it with an accountant, analyst, or for internal reporting.
- All changes to the indicator settings are recorded in the "History" tab, so you can always check who made them and when.